
Wednesday, October 21, 2026 | Operations & Leadership Perspectives
Monday we looked inside the operating system.
Tuesday we looked at how AI is changing leadership, accountability, and the role of the manager.
Today we look outside the company.
Three external signals deserve executive attention right now:
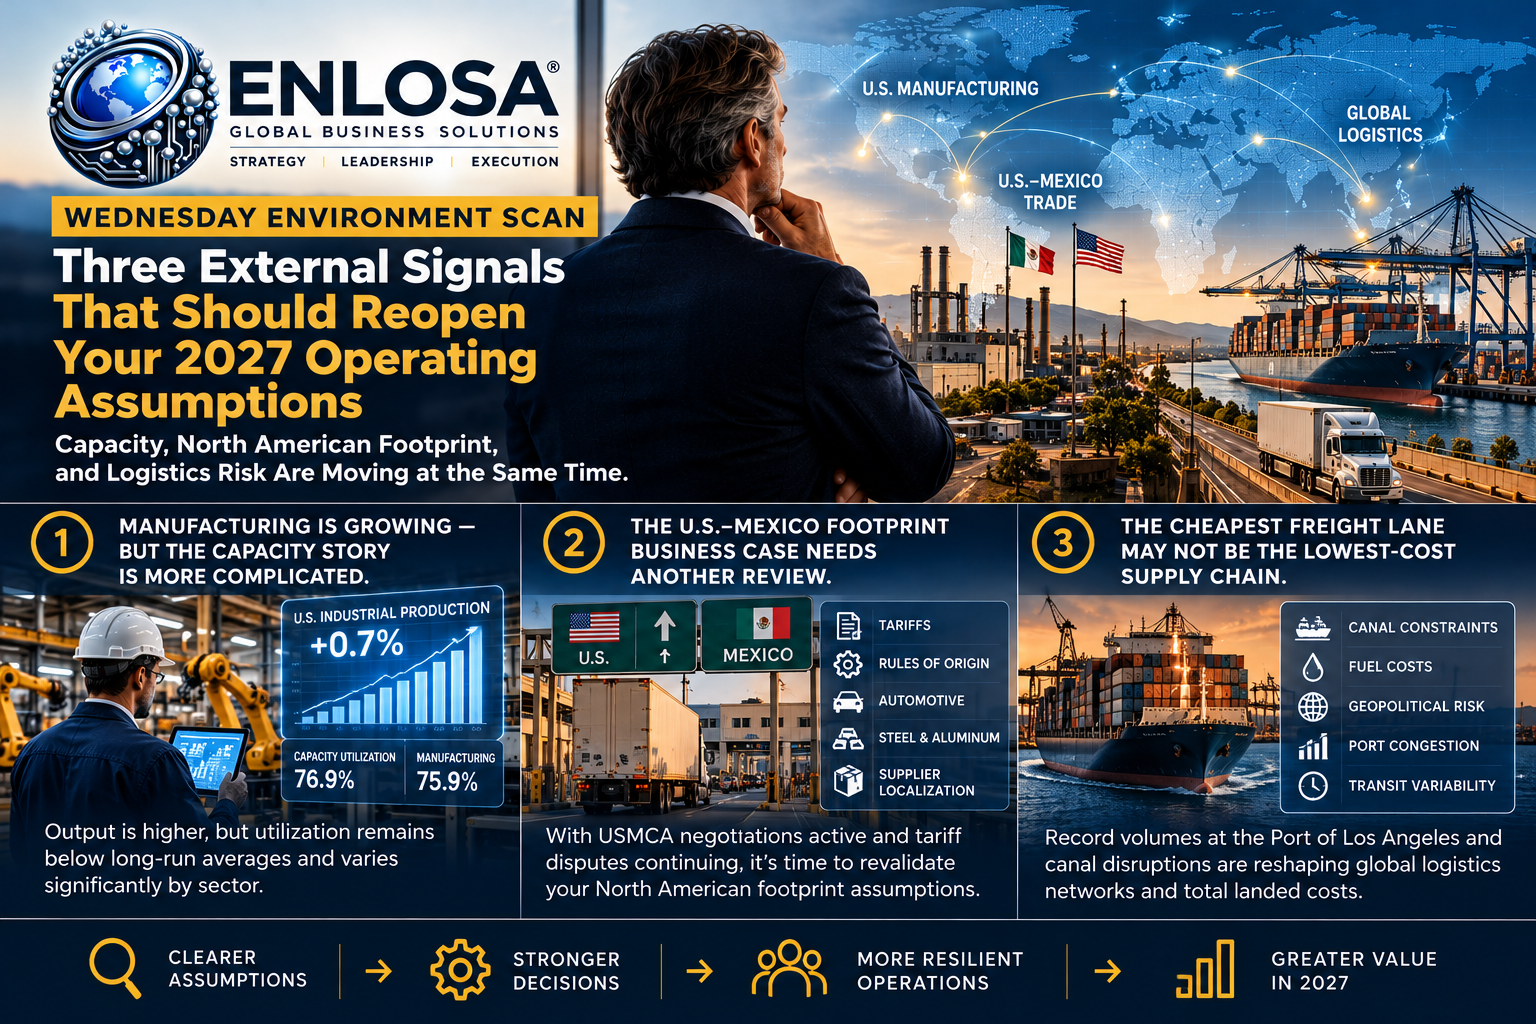
- U.S. industrial production is improving, but broad capacity utilization remains below long-run averages.
- U.S.–Mexico trade assumptions are moving again as USMCA negotiations and tariff disputes continue.
- Global logistics routing is shifting as canal constraints, fuel costs, and geopolitical risks push more cargo toward alternative gateways.
At first glance, these appear to be three unrelated developments.
They are not.
Together they raise a much larger leadership question:
Are the assumptions behind your 2027 operating plan still true?
The danger is not that executives are ignoring the environment.
Most leadership teams are watching the news.
The danger is that they continue operating with business cases, sourcing models, capacity plans, and logistics assumptions that were built under different conditions.
An environment scan has value only when it changes a decision.
Signal 1: Manufacturing Is Improving — But the Capacity Story Is More Complicated
The Federal Reserve’s October 16 industrial-production release showed stronger September activity.
Total U.S. industrial production increased 0.7% in September, manufacturing output rose 0.3%, and total industrial production was 2.2% above its level a year earlier. Federal Reserve
At first glance, that supports a positive manufacturing narrative.
But executives should keep reading.
Total industry capacity utilization rose to 76.9%, still 2.5 percentage points below its 1972–2025 average. Manufacturing capacity utilization was 75.9%, or 2.3 percentage points below its own long-run average.
That means the headline is not:
“America is out of capacity.”
Nor is it:
“There is plenty of capacity everywhere.”
The real message is:
Capacity remains uneven.
And uneven capacity is exactly where bad capital decisions begin.
The Average Factory Does Not Exist
National capacity utilization is useful for understanding macro conditions.
It is dangerous when used as a substitute for understanding your own bottleneck.
A company may operate in an economy where total manufacturing utilization is below historical averages and still have a molding department running at 95%, a heat-treatment bottleneck, a coating line with no remaining weekend capacity, a distribution center exceeding design throughput, a critical supplier unable to support additional demand, or a skilled-trades constraint that makes theoretical equipment capacity irrelevant.
The opposite can also happen.
A business may believe it needs another machine because one department is missing schedule.
But the real constraint may be poor changeovers, unstable scheduling, maintenance response, material availability, labor imbalance, quality holds, or low utilization on an asset already installed.
This is why Monday’s capacity question matters even more when paired with external data:
Do not use macro tightness to justify CapEx that your own operating system has not yet justified.
The Sector Mix Matters Too
The September Fed data show why averages can mislead.
Manufacturing output rose overall, but motor vehicles and parts declined 3.0% in September. At the same time, durable manufacturing growth in the third quarter was supported in part by a 28.4% annualized increase in semiconductor and related electronic-component output.
Those are not small differences.
They show that one sector can be expanding rapidly while another weakens.
So the executive question should not be:
“Is manufacturing strong?”
It should be:
“What is happening in the specific demand, capacity, supplier, and technology environment that drives our business?”
What COOs and CFOs Should Revalidate
Before the 2027 capital plan is locked, recheck:
- Constraint capacity: What asset actually limits throughput?
- Demand concentration: Which product families are growing, and which are weakening?
- Installed-capacity recovery: How much output can be recovered through downtime, scrap, changeover, scheduling, and labor improvements?
- Supplier capacity: Does the constraint sit inside your factory—or in someone else’s?
- Technology dependence: Are the fastest-growing segments changing equipment, labor, or supply requirements?
- Capital timing: Does new demand justify investment now, or should the organization first unlock capacity already purchased?
The Fed data are not a capital-investment answer.
They are a trigger to ask better questions.
Signal 2: The U.S.–Mexico Footprint Business Case Needs Another Review
The second external signal is more strategic.
U.S.–Mexico trade negotiations remain active, and current disputes involve some of the most manufacturing-intensive sectors.
USTR has been working through the USMCA review process and specifically identified automotive rules of origin, steel and aluminum, and economic security as priority issues in bilateral negotiations with Mexico. USTR
On October 2, USTR also opened a formal public consultation process in advance of the 2027 USMCA joint review, with comments due January 12, 2027. USTR
Meanwhile, recent reporting indicates U.S.–Mexico talks have been complicated by disagreements over tariffs on steel, aluminum, and automobiles. Wall Street Journal
For companies operating across North America, the correct response is not panic.
It is revalidation.
Nearshoring Is Not a Strategy by Itself
For several years, “nearshoring to Mexico” has often been presented as if it were a single decision.
It is not.
A footprint business case contains many assumptions: labor cost, productivity, tariff treatment, rules of origin, supplier location, cross-border freight, border dwell time, working capital, customer proximity, energy, infrastructure, management capability, ramp risk, capital cost, regulatory requirements, and the percentage of content that must qualify under trade rules.
When one of those assumptions moves, the project may still be attractive.
When several move together, the economics can change materially.
A nearshoring thesis should be revalidated like any other investment thesis.
The Most Important Question Is Not “Is Mexico Still Good?”
That question is too broad.
Mexico may remain highly attractive for many manufacturing models.
The real question is:
“Is our specific Mexico/U.S. footprint still optimal under today’s assumptions?”
That is a very different discussion.
A plant serving North American customers with highly integrated regional sourcing may have a strong business case.
A different plant that depends heavily on imported non-regional inputs, crosses borders multiple times, and has weak productivity may have a more fragile one.
One model cannot answer both.
Reopen the Footprint Model
Executives should re-run at least eight assumptions.
1. Tariff exposure
What duties apply today? What could materially change under the current negotiating path? Which products are most sensitive?
2. Rules of origin
Does the current bill of material qualify? Could future interpretation or negotiation change the percentage of regional content required?
3. Steel and aluminum content
If the product or equipment base is exposed to metals tariffs, where does that cost sit? Can sourcing change?
4. Automotive exposure
For automotive businesses, do current rebate structures, component rules, or tariff treatment change the original economics?
5. Supplier localization
What percentage of the supply base is truly North American? How much is simply routed through North America after originating elsewhere?
6. Cross-border logistics
How much border dwell time is assumed? How much variability exists? How much inventory is carried because of it?
7. Working capital
How many additional days of inventory does the footprint require? What is the cash value?
8. Management capacity
Can the organization actually launch, stabilize, and manage the footprint?
A financial model that assumes flawless execution is not a business case.
It is a best-case scenario.
One Question for Every North American Footprint Review
The most useful question may be the simplest:
If we had to approve the remaining investment today, using today’s trade, tariff, freight, labor, and operating assumptions, would we still approve it?
If the answer is yes, confidence improves.
If the answer is no, continuing simply because money has already been spent is not strategy.
That is sunk-cost behavior.
Signal 3: The Cheapest Freight Lane May Not Be the Lowest-Cost Supply Chain
The third signal is appearing in global logistics.
The Port of Los Angeles handled 1,042,652 TEUs in September, its busiest month in 118 years. Loaded imports increased 19% year over year, and the port completed its busiest quarter on record. Port of Los Angeles
Part of the story is demand and frontloading.
But routing behavior is also changing.
Supply Chain Dive reported that continuing concerns around the Panama and Suez canals were driving roughly 5% more cargo to be allocated at origin toward Los Angeles, according to Port Executive Director Gene Seroka. Supply Chain Dive
The same report cited MarineTraffic data showing 69 container vessels waited more than 100 hours to transit the Panama Canal from January through late September 2026, versus 13 during the same period in 2025.
The Panama Canal has also been adjusting transit availability in response to water conditions, while carriers and shippers continue weighing Red Sea and Suez risks.
This is not simply a freight story.
It is a network-design story.
Freight Rate Is Only One Line in the Cost Model
A logistics team may identify one route as cheaper based on the ocean rate.
But total landed economics can look very different once you include transit variability, safety stock, port congestion, additional inventory days, expediting, lost sales, production interruption, demurrage, detention, premium freight, customer penalties, financing cost, and management time.
That leads to a principle operations leaders should use more often:
The cheapest freight lane is not necessarily the lowest-cost supply chain.
Reliability Has a Financial Value
Suppose Route A saves $500 per container.
But it creates five additional days of uncertainty.
Those five days may require more inventory, more working capital, a larger safety-stock buffer, more schedule changes, and greater customer risk.
Route B may look more expensive in transportation cost.
But it may create lower total enterprise cost.
The finance team should be involved in that calculation.
Not after the logistics decision.
During it.
Build a Second-Best Network Before You Need It
Most companies know their primary routing.
Far fewer have a fully costed second-best option.
That should change.
For critical lanes, leadership should know:
- Primary port.
- Alternative port.
- Primary carrier.
- Alternative carrier.
- Transit-time difference.
- Cost difference.
- Inventory impact.
- Customer-service impact.
- Required activation lead time.
- Customs implications.
- Warehousing alternatives.
- Drayage availability.
- Rail alternatives.
The objective is not to reroute everything today.
The objective is to know what you will do before disruption forces you to improvise.
Resilience is cheaper when designed before the crisis.
The Three Signals Are Connected
Now put the three together.
U.S. manufacturing output improves.
Your company interprets the signal as stronger demand.
The plant requests more capacity.
At the same time, the original Mexico footprint assumptions are shifting because trade terms remain under negotiation.
Then global freight patterns change, increasing variability and working-capital requirements.
If leadership evaluates each signal separately, it may make three disconnected decisions:
- Approve CapEx.
- Continue the footprint investment.
- Change the shipping lane.
But those decisions interact.
A different footprint may change capacity needs.
A different route may change inventory.
Higher inventory changes working capital.
Tariffs change landed cost.
Supplier localization changes both trade exposure and logistics risk.
The environment is a system. Your operating assumptions should be reviewed as a system too.
A 2027 Operating-Assumption Reset
This Wednesday Environment Scan should lead to action.
A practical executive reset can be run in four steps.
Step 1 — List the assumptions
Take the current operating plan.
Write down the assumptions supporting demand, price, capacity, productivity, CapEx, labor, footprint, tariffs, rules of origin, supplier location, freight, inventory, working capital, and customer service.
Do not leave them embedded inside spreadsheets.
Make them visible.
Step 2 — Mark what changed
For each assumption, ask:
- Has it improved?
- Worsened?
- Become more volatile?
- Or remained stable?
Use external evidence where possible.
Step 3 — Recalculate the economics
Do not simply discuss the change.
Convert it into margin, cash, working capital, CapEx, service, risk, and return on invested capital.
Step 4 — Decide
Each assumption review should end with one of four decisions:
- Continue.
- Accelerate.
- Modify.
- Stop.
Otherwise the environment scan becomes another presentation.
Questions for Your Leadership Team This Week
- What capacity assumption in our 2027 plan would we challenge if we started from zero today?
- Are we using national manufacturing averages to justify a local constraint we have not actually measured?
- Which of our major footprint investments depends most heavily on current USMCA or tariff assumptions?
- If we had to approve our Mexico/U.S. footprint again today, would we make the same decision?
- How much inventory do we carry because of transportation variability rather than customer demand?
- For our five most critical logistics lanes, do we have a fully costed alternative route?
- How much working capital is tied to network uncertainty?
- Which supplier or plant location becomes unattractive if trade treatment changes materially?
- What CapEx decision would change if we recovered another 10% of capacity from the existing system?
- Which external assumption could invalidate the largest amount of value in our current operating plan?
That final question deserves executive attention.
The ENLOSA Perspective
At ENLOSA: Global Business Solutions, we call the connection between strategy and execution Stratactic™.
An environment scan is part of strategy.
But value is created only when the organization connects the external signal to an operating decision.
Industrial-production data should trigger a capacity review.
Trade-policy movement should trigger a footprint review.
Logistics instability should trigger a network and working-capital review.
Do not react to every headline. Revalidate the assumptions that matter.
The objective is not to predict perfectly what the Federal Reserve, USTR, Mexico, the Panama Canal, carriers, or markets will do next.
The objective is to build an operating plan that knows which assumptions matter most and can adapt when those assumptions move.
That is the difference between monitoring the environment and managing through it.
The best operating plan is not the one with the most accurate forecast.
It is the one that makes changing assumptions visible early enough to act.
References
- Federal Reserve Board — Industrial Production and Capacity Utilization, October 16, 2026. Industrial production increased 0.7% in September, manufacturing output rose 0.3%, total capacity utilization reached 76.9%, and manufacturing capacity utilization was 75.9%. Source
- Office of the U.S. Trade Representative — USMCA Review and U.S.–Mexico Negotiations. USTR has identified automotive rules of origin, steel and aluminum, economic security, and regulatory issues as active areas of negotiation, and opened public consultation in advance of the 2027 USMCA review. Source
- Wall Street Journal — U.S.–Mexico trade negotiations. Recent negotiations have faced disagreements over tariffs affecting steel, aluminum, and automobiles. Source
- Port of Los Angeles — September 2026 Cargo Record. The port handled more than 1.04 million TEUs in September, its busiest month on record. Source
- Supply Chain Dive — Panama Canal Challenges Drive Shippers to Los Angeles, October 13, 2026. Canal concerns, longer waits, and fuel costs are influencing routing decisions and moving additional cargo toward the U.S. West Coast. Source
ENLOSA: Global Business Solutions
Strategy. Leadership. Execution.
enlosa@enlosa.com | +1 (877) 246-1109
#WednesdayEnvironmentScan #Manufacturing #IndustrialProduction #CapacityUtilization #CapEx #USMCA #Mexico #Nearshoring #FootprintStrategy #Trade #Tariffs #SupplyChain #Logistics #PanamaCanal #PortOfLosAngeles #WorkingCapital #Inventory #RiskManagement #COO #CFO #CEO #OperationalExcellence #OperationalValueCreation #Stratactic #EGBS
Leave a Reply