
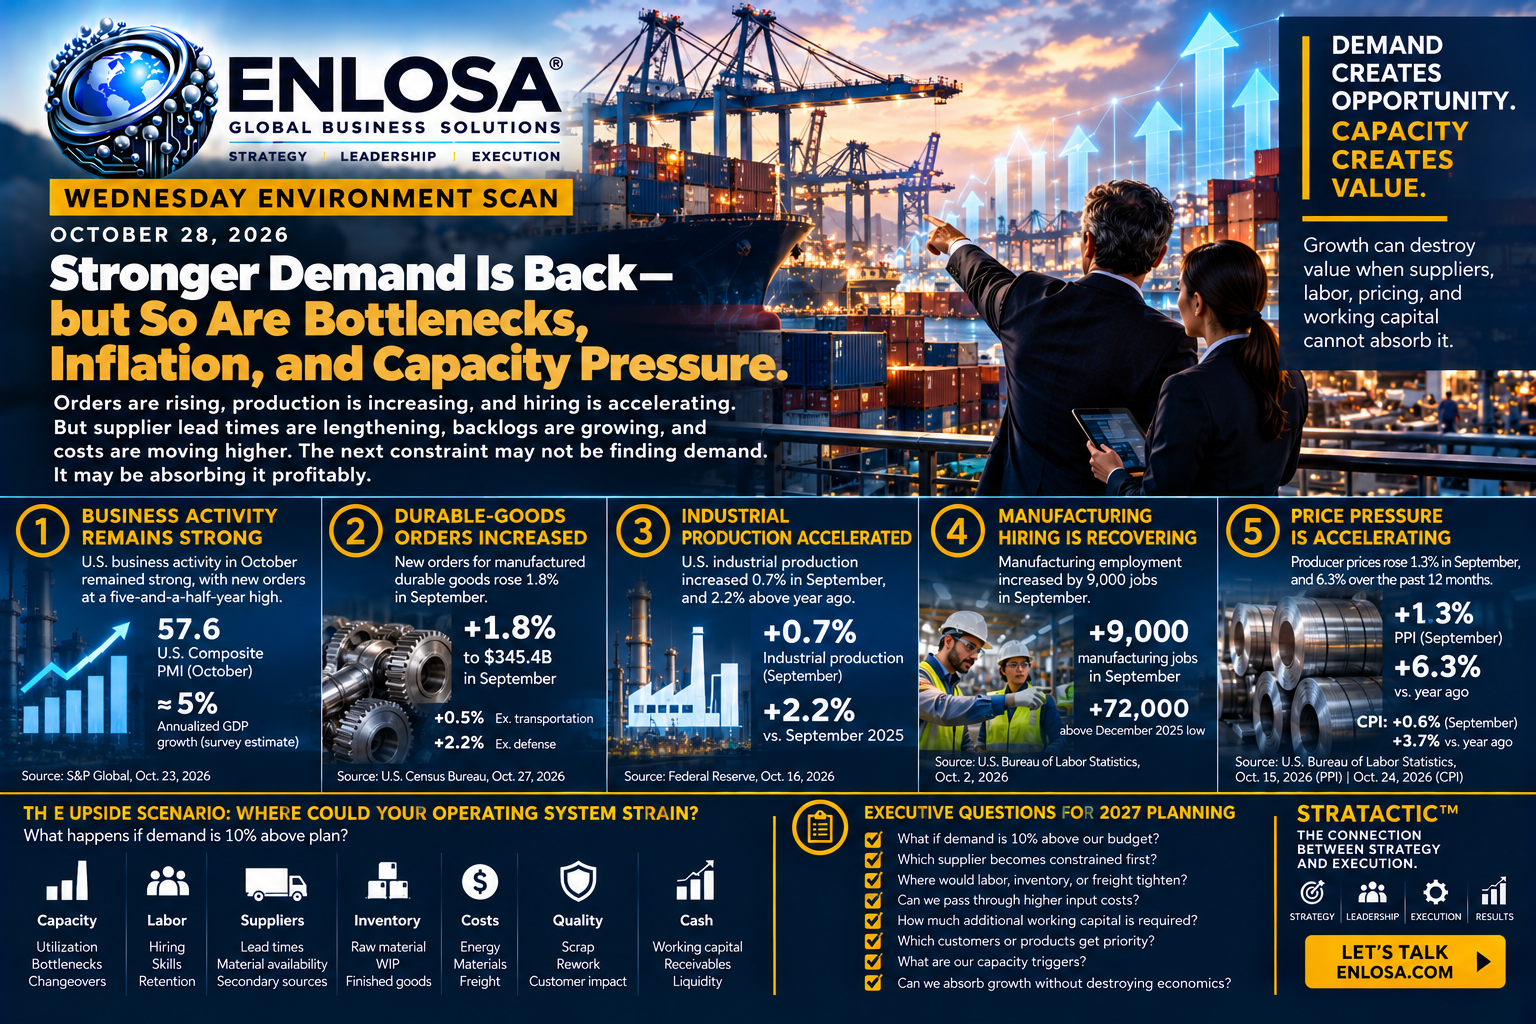
The 2027 downside case is not the only scenario leadership should prepare for. Growth can destroy value when suppliers, capacity, labor, pricing, and working capital cannot absorb it.
Wednesday, October 28, 2026 | Environment Scan & Operational Value Creation
Monday we argued that companies should stop treating the 2027 budget as the operating system.
Tuesday we examined who—and what—should have authority to make decisions inside that system.
Today we need to challenge one of the assumptions being put into it.
What happens if demand is stronger than your 2027 plan expects?
For much of the past few years, executive planning has concentrated heavily on downside risk.
Slower growth. High financing costs. Tariffs. Geopolitical instability. Weak demand. Inventory corrections. Cost pressure.
Those risks have not disappeared.
But several of the latest U.S. indicators are pointing in another direction.
Orders are strengthening. Industrial production is rising. Durable-goods demand increased again. Manufacturing employment has been recovering. Backlogs are accumulating. Supplier delivery times are lengthening. And price pressure has accelerated.
That combination creates a very different operating problem.
The next constraint may not be finding demand.
It may be absorbing it profitably.
Signal 1: October Business Activity Remains Strong
S&P Global’s October flash U.S. PMI provides one of the clearest leading signals.
The survey reported that U.S. business activity remained strong at the start of the fourth quarter, with its output measures consistent with roughly 5% annualized GDP growth.
More important for operators, S&P reported that new-order growth accelerated to a five-and-a-half-year high.
At the same time, companies reported increasing backlogs, stronger hiring, worsening supplier delivery performance, and accelerating selling-price inflation. S&P Global
That matters because new orders do not remain economic statistics for very long.
They become customer commitments, production requirements, supplier releases, material purchases, labor requirements, inventory, transportation, working capital, and capacity decisions.
The macro signal eventually becomes an operating requirement.
Signal 2: The Hard Data Are Also Moving
The October PMI is survey-based, so leadership should not rely on it alone.
Fortunately, recent official data point in the same general direction.
The U.S. Census Bureau reported on October 27 that new orders for manufactured durable goods increased 1.8% in September to $345.4 billion.
Orders have now risen in six of the previous seven months.
Excluding transportation, orders increased 0.5%.
Excluding defense, they increased 2.2%.
Transportation equipment led the increase with a 4.6% gain. U.S. Census Bureau
One month never proves a cycle.
But when rising durable-goods orders appear alongside stronger PMI new orders, rising production, and increasing backlogs, leadership teams should at least question whether their 2027 demand assumptions remain conservative enough.
The correct response is not “the boom has arrived.”
It is:
“Should we now stress-test the upside case?”
Signal 3: Industrial Production Accelerated in September
The Federal Reserve reported that U.S. industrial production increased 0.7% in September after edging up 0.1% in August.
Manufacturing output increased 0.3%.
Total industrial production was 2.2% above September 2025 levels, while third-quarter industrial production increased at a 2.8% annual rate. Federal Reserve
Again, the point is not that every industrial sector is booming.
They are not.
The point is that the operating environment entering Q4 looks materially different from one characterized by uniformly weak demand.
That should matter to executives finalizing 2027 assumptions.
Signal 4: Manufacturing Employment Has Been Recovering
The labor data add another layer.
The Bureau of Labor Statistics reported that manufacturing employment increased by 9,000 jobs in September.
More importantly, manufacturing employment was 72,000 jobs above its recent low in December 2025.
Machinery manufacturing and plastics and rubber products manufacturing each added about 5,000 jobs during September. U.S. Bureau of Labor Statistics
S&P Global’s October survey then indicated that manufacturing payroll growth accelerated further, reaching its strongest surveyed pace since March 2012.
The official October employment report will not be released until November 6, so that PMI signal should be treated as an early indicator rather than a confirmed payroll count.
But the direction deserves attention.
If industrial hiring continues strengthening, specific technical labor categories may tighten quickly.
Maintenance technicians. Controls engineers. Machinists. Electricians. Production supervisors. Automation specialists. Quality engineers. Supply-chain planners. Process engineers.
The national labor market does not need to become universally tight before your critical roles become scarce.
Labor constraints become local, technical, and role-specific long before they become obvious in national averages.
But Stronger Demand Is Already Meeting Resistance
The most important information in the October PMI may not be the headline growth number.
It may be what is happening behind it.
S&P Global reported that backlogs of unfinished work increased at their fastest rate since May 2022.
Supplier delivery times also deteriorated to their greatest extent since 2022.
Survey respondents cited material shortages, low inventory, overloaded suppliers, labor shortages, back orders, shipping delays, and import delays.
That combination should get the attention of every COO, CFO, supply-chain leader, and plant executive.
Backlog growth looks attractive on a commercial dashboard.
But operationally it can mean:
Demand is entering the organization faster than the operating system can convert it into revenue.
That determines whether growth creates value—or consumes it.
The Upside Case Can Be Dangerous Too
Leadership teams naturally stress-test downside scenarios.
What if sales fall 10%? What if a customer leaves? What if the economy slows? What if tariffs rise?
Those are necessary.
But Wednesday’s environment scan suggests a second question:
What if demand is 10% above plan?
What fails first?
Supplier capacity? Internal equipment? Labor? Tooling? Maintenance? Quality? Engineering? Warehouse space? Logistics? Working capital? Or management bandwidth?
Growing faster than the operating system can support often produces familiar symptoms:
- Premium freight.
- Overtime.
- Late deliveries.
- Quality failures.
- Expediting.
- Emergency sourcing.
- Supplier price increases.
- Inventory growth.
- Unplanned CapEx.
- Customer dissatisfaction.
- Manager burnout.
- Cash consumption.
Revenue growth is not automatically value creation.
The Capacity Paradox: National Slack and Local Bottlenecks Can Coexist
There is an important nuance.
Federal Reserve data do not show the U.S. industrial system operating at historically extreme utilization.
Total industrial capacity utilization increased to 76.9% in September, still 2.5 percentage points below its 1972–2025 average.
Manufacturing utilization was 75.9%, 2.3 percentage points below its long-run average.
So how can companies simultaneously report capacity pressure?
Because:
National capacity is not your capacity.
Aggregate utilization combines different industries, different technologies, different geographies, different products, different skills, different equipment, and different positions in the value chain.
Unused capacity somewhere in the economy does not help when your growth requires a specific casting, a semiconductor, a qualified aerospace supplier, a specialized forging, a particular resin, a certain machine, a validated source, or an experienced controls engineer.
The Federal Reserve’s own capacity data illustrate how uneven the system is: capacity in selected high-technology industries has been expanding far faster than capacity across manufacturing overall. Federal Reserve capacity data
Aggregate slack can coexist with very expensive bottlenecks.
Do Not Use Macro Capacity to Answer a Plant-Level Question
If your organization believes it needs additional capacity, do not begin with national utilization.
Begin with your constraint.
- What is theoretical capacity?
- What is demonstrated capacity?
- What is effective capacity?
- What is the true constraint?
- What capacity disappears through changeovers?
- What capacity disappears through downtime?
- What capacity disappears through scrap?
- What capacity disappears because qualified labor is unavailable?
- What capacity disappears because product mix is different from the original equipment assumption?
- How much capacity exists upstream at the supplier?
And:
How much additional profitable demand could this value stream absorb tomorrow?
That is the number leadership needs.
A Purchase Order Is Not Capacity
The same discipline applies to suppliers.
A supplier may have a contract with you.
That does not mean the supplier has enough physical capacity to support an upside case.
When supplier lead times are already lengthening, ask:
- How much capacity is contractually committed?
- How much is actually demonstrated?
- What percentage of the supplier’s output do we consume?
- Who else competes for the same equipment?
- Which raw material constrains the supplier?
- What technical labor does the supplier depend on?
- Can they add a second shift?
- How quickly?
- Who owns the tooling?
- Is another qualified source available?
- How long would qualification take?
A purchase order is not capacity.
That principle becomes expensive to learn after the market tightens.
Inflation Is Reinforcing the Operating Pressure
The demand signal is occurring alongside substantial cost pressure.
The Bureau of Labor Statistics reported that the Producer Price Index for final demand increased 1.3% in September, the largest monthly increase since March 2022.
Over the previous 12 months, final-demand producer prices increased 6.3%, the strongest year-over-year increase since December 2022.
Prices for final-demand goods alone increased 2.6% in September. U.S. Bureau of Labor Statistics
Consumer inflation has also accelerated.
The September Consumer Price Index increased 0.6% for the month and 3.7% over the year. U.S. Bureau of Labor Statistics
The October PMI adds a forward-looking signal: S&P Global reported the sharpest surveyed increase in selling prices in more than four years.
That creates an uncomfortable planning combination:
Higher demand.
Higher input costs.
Longer supplier lead times.
Growing backlogs.
2027 plans that assume stronger volume but stable cost structures deserve another look.
Revenue Can Beat Plan While EBITDA Misses
Imagine demand is 10% above your budget.
Commercial leadership celebrates.
But fulfilling that growth requires overtime, premium freight, spot-market material, supplier surcharges, temporary labor, faster hiring, more inventory, expedited maintenance, and unplanned equipment spending.
Revenue beats plan.
Margin does not.
Cash may deteriorate.
That is why an upside scenario must model operating economics—not simply increase the sales line.
A sales upside is not automatically an EBITDA upside.
Pricing Power Is Useful—but It Can Hide Waste
Strong demand may allow companies to increase price.
That is valuable when legitimate input inflation needs to be recovered.
But pricing can also conceal operational inefficiency.
Suppose price increases cover poor scheduling, excessive overtime, premium freight, scrap, emergency sourcing, and supplier inefficiency.
The P&L survives.
The process does not improve.
Then demand eventually normalizes.
Pricing power weakens.
The inefficiency remains.
Use pricing to protect economics—not to excuse poor execution.
Build the Upside Case Into the 2027 Operating System
Monday’s article proposed moving from a static budget to a dynamic operating system.
Today’s signal gives us a practical application.
Take your current 2027 plan.
Create a second case:
Demand +10%
Then do not simply multiply revenue by 1.10.
Rebuild the operating assumptions underneath it.
What happens to capacity, labor, suppliers, inventory, working capital, freight, quality, lead time, pricing, CapEx, cash, customer service, and management capability?
The objective is to discover where growth stops being economically attractive.
1. Stress-Test Internal Capacity
For the most important value streams, identify:
- Theoretical capacity — What should the process produce on paper?
- Demonstrated capacity — What has it actually produced sustainably?
- Effective capacity — What remains after downtime, quality loss, changeovers, labor, and mix?
- Constraint — What resource actually limits throughput?
Then identify the point where operating behavior starts deteriorating.
Watch backlog, schedule adherence, overtime, maintenance compliance, downtime, scrap, lead time, and premium freight.
Capacity pressure usually announces itself before the plant reaches a theoretical maximum.
2. Stress-Test Supplier Capacity
Select the suppliers whose failure or constraint would create the largest financial consequence.
For each, document current volume, committed volume, demonstrated maximum capacity, lead time, tooling, raw-material exposure, labor exposure, alternate sources, qualification time, and geographic risk.
Then ask a simple question:
If we request 15% more volume within 60 days, can this supplier deliver it reliably?
“We believe so” is not enough.
Look for evidence.
3. Stress-Test Technical Talent
Do not treat the workforce plan as a headcount spreadsheet.
BLS data show manufacturing employment has recovered from its late-2025 low, and current business surveys point toward stronger industrial hiring.
Ask which roles constrain production, how long recruiting takes, how long qualification takes, whether one shift can operate without a specific technician, how much critical knowledge exists with only one person, whether automation can remove low-value labor requirements, whether cross-training can create flexibility, and where the succession pipeline fails.
A headcount plan is not a capability plan.
4. Stress-Test Working Capital
Growth consumes cash before it generates cash.
Additional orders may require more raw material, more WIP, more finished goods, supplier deposits, more freight, higher receivables, and more safety stock.
Companies can report record revenue while simultaneously creating a liquidity problem.
The CFO and COO should calculate:
How much incremental working capital is required for every additional dollar of growth?
Then: When is cash spent? When does inventory turn? When does the customer pay?
Growth economics are incomplete without those answers.
5. Stress-Test the Customer Promise
Demand growth creates pressure to say yes.
Sales wants the order. Operations needs time. The customer wants delivery. Leadership wants revenue.
That can produce unrealistic commitments.
When capacity tightens, leadership may need to decide which customer receives capacity, which product receives capacity, which order receives priority, which margin deserves constrained resources, which commitment should be delayed, and which business should not be accepted.
Capacity allocation is an economic decision—not merely a scheduling decision.
6. Stress-Test Pricing
With producer prices rising sharply, understand exactly how inflation moves through your commercial model.
For each major customer or product:
- Can costs be passed through?
- How quickly?
- Is there a contractual mechanism?
- What lag exists?
- Which inputs are indexed?
- Which margins cannot absorb another increase?
- Which customers have negotiating power?
- What happens if costs rise another 5%?
Leadership should know where pricing can defend value before margin deteriorates.
7. Stress-Test Quality
Growth pressure frequently reaches quality before leadership notices.
Higher demand can mean more overtime, faster equipment speeds, new employees, shorter training, more changeovers, alternative suppliers, and less maintenance time.
Those decisions can create a hidden tax.
Track first-pass yield, scrap, rework, supplier defects, customer complaints, warranty, and deviation activity.
If sales rise while these measures deteriorate, the company may be creating future liabilities alongside current revenue.
Change the Early-Warning Dashboard
The traditional financial dashboard will often identify the problem after the operating system has already deteriorated.
Add leading indicators.
Order intake. Backlog. Quote volume. Supplier lead time. Supplier past dues. Schedule adherence. Overtime. Premium freight. Machine downtime. Technical vacancies. Inventory days. First-pass yield. Purchase-price variance. Customer expedite requests.
Then look at the relationships between them.
- Backlog ↑ + Lead time ↑ — Possible capacity constraint.
- Backlog ↑ + overtime ↑ — Labor or throughput pressure.
- Revenue ↑ + premium freight ↑ — Growth may be leaking margin.
- Output ↑ + scrap ↑ — The process may be operating beyond stable capacity.
- Sales ↑ + working capital ↑ faster — Growth may be consuming cash.
- Supplier lead time ↑ + inventory ↓ — Continuity exposure may be increasing.
- Price ↑ + productivity flat — Pricing may be masking inefficiency.
Do not simply display indicators. Interpret the system they describe.
Do Not Automatically Respond With CapEx
Stronger orders naturally create investment pressure.
But permanent capital should not automatically solve a temporary operating problem.
Before approving expansion, answer four questions.
Is the demand real?
Is it a firm order, a contract, a forecast, a market assumption, or temporary inventory building?
S&P Global itself notes that some recent economic activity has been supported by precautionary inventory behavior, which is another reason not to extrapolate every strong reading indefinitely.
Is the constraint real?
Identify the actual bottleneck.
Not the loudest department.
Can current capacity be unlocked?
Through OEE improvement, maintenance, scheduling, changeover reduction, quality improvement, labor flexibility, product-mix redesign, automation, or supplier changes.
Does new capacity create acceptable return across scenarios?
Run base case, upside case, and downside case.
Do not buy permanent capacity before proving the economic need.
But Do Not Wait for Perfect Certainty
The opposite mistake is equally dangerous.
Leadership waits until demand is undeniable.
By then suppliers may be full, equipment lead times may be longer, engineering resources may be constrained, construction costs may have increased, technical labor may be harder to secure, and competitors may already hold the supplier capacity.
Certainty is often expensive.
The challenge is developing enough evidence to act before the constraint becomes obvious to everybody else.
Establish Capacity Triggers Before You Need Them
Do not debate expansion from scratch after the crisis begins.
Define operating triggers in advance.
- If backlog exceeds an agreed level — trigger capacity review.
- If demonstrated utilization remains above a threshold for several weeks — open the expansion gate.
- If premium freight exceeds a defined limit — investigate structural capacity.
- If supplier lead time exceeds tolerance — activate secondary-source work.
- If overtime remains elevated — review labor and capacity options.
- If service deteriorates — escalate.
Your thresholds must come from your economics.
But the principle matters:
Predefined triggers compress decision time.
The CFO and COO Need One Upside Model
The COO sees orders, volume, people, suppliers, capacity, and service.
The CFO sees revenue, margin, inventory, receivables, CapEx, and cash.
Those are not separate realities.
They are the same operating system.
For the upside case, Finance and Operations should jointly model volume, price, variable cost, labor, supplier capacity, inventory, receivables, freight, CapEx, cash, margin, and return.
Growth planning must connect the income statement, balance sheet, cash flow, and operating system.
The CEO’s Real Question
The strategic question is not:
Can we grow?
It is:
Can we absorb growth without destroying its economics?
Growth without capacity creates service failure.
Growth without labor creates burnout.
Growth without quality creates customer problems.
Growth without supply creates shortages.
Growth without pricing creates margin compression.
Growth without working capital creates cash pressure.
Growth without management discipline creates chaos.
The objective is profitable, cash-generative, repeatable growth.
A 30-Day Upside Readiness Review
Week 1 — Identify the Constraint
Take the five products, customers, or markets most likely to outperform the 2027 plan.
Determine the first constraint: internal capacity, supplier, technical talent, engineering, logistics, or working capital.
Week 2 — Quantify the Upside
Run demand +5%, demand +10%, and demand +15%.
Determine where incremental economics improve—and where operating performance begins deteriorating.
Week 3 — Build the Options
For each constraint identify possible responses: overtime, second shift, cross-training, secondary sourcing, inventory buffers, automation, outsourcing, CapEx, pricing, and customer prioritization.
Week 4 — Establish Trigger Points
Define the exact conditions that activate those responses.
Do not wait for the problem.
Pre-build the decision.
Questions for Your Leadership Team
- What happens if demand is 10% above budget?
- Which supplier reaches its constraint first?
- Which internal operation becomes the bottleneck first?
- Which technical capability becomes scarce first?
- How much incremental working capital does 10% additional growth require?
- Which product creates sales growth without enough incremental margin?
- Where would premium freight appear first?
- How much capacity can be unlocked before new CapEx is required?
- What CapEx trigger should be established now?
- Which supplier capacity commitment have we never independently validated?
- Which leading indicator tells us the operating system is beginning to strain?
- How quickly can we reallocate people and capital if the upside case appears?
If leadership’s answer is “We will figure it out when it happens,” then the upside scenario is not a plan.
It is hope.
The ENLOSA Perspective
At ENLOSA: Global Business Solutions, we call the connection between strategy and execution Stratactic™.
An environment scan matters only if external evidence changes internal decisions.
This week’s sequence is becoming clear.
Monday: Build the operating system.
Tuesday: Clarify decision authority.
Wednesday: Feed the operating system new evidence.
Then ask the most important question:
What changes now?
Today’s evidence does not prove that every industry is entering a boom.
It does not mean every company should add capacity.
And it does not eliminate downside risk.
The Federal Reserve’s utilization data are a useful reminder that significant aggregate capacity remains available nationally.
But the combination of stronger new orders, rising durable-goods demand, higher industrial production, increasing backlogs, supplier delays, recovering manufacturing employment, and significant producer-price inflation deserves attention.
The planning implication is straightforward:
Weak demand is no longer the only scenario worth preparing for.
Growth may arrive faster than expected.
The organizations that benefit will not necessarily be the companies receiving the most orders.
They will be the companies whose operating systems can convert those orders into revenue, margin, cash, customer performance, and sustainable enterprise value.
Wednesday Executive Call to Action
Before approving the 2027 operating plan, run one additional scenario:
Demand: +10% above budget.
Then recalculate capacity, supplier requirements, labor, inventory, working capital, quality, freight, pricing, CapEx, and cash.
Do not ask only:
“How much more could we sell?”
Ask:
“Where would the operating system break first?”
Name the constraint.
Assign the owner.
Define the early-warning indicator.
Establish the trigger.
Prepare the response.
Because the next surprise may not be that demand disappears.
It may be that demand returns faster than your organization can profitably absorb it.
Prepare for both.
References
- S&P Global Market Intelligence — “US Flash PMI Signals Sustained Strong Growth, but Also Further Inflation Uplift in October,” October 23, 2026. October’s flash survey indicated strong U.S. business activity, new orders at a five-and-a-half-year high, increasing backlogs, faster hiring, worsening supplier delivery times, and stronger selling-price inflation. Source
- U.S. Census Bureau — Monthly Advance Report on Durable Goods Manufacturers’ Shipments, Inventories and Orders, October 27, 2026. September durable-goods orders increased 1.8% to $345.4 billion; orders excluding transportation rose 0.5% and orders excluding defense increased 2.2%. Source
- Federal Reserve Board — Industrial Production and Capacity Utilization, October 16, 2026. September industrial production increased 0.7%, manufacturing production increased 0.3%, and total industrial output stood 2.2% above its year-earlier level. Total capacity utilization was 76.9% and manufacturing utilization 75.9%, both below long-run averages. Source
- U.S. Bureau of Labor Statistics — Employment Situation, September 2026, released October 2, 2026. Manufacturing employment increased by 9,000 in September and was 72,000 above its December 2025 low. Source
- U.S. Bureau of Labor Statistics — Producer Price Index, September 2026, released October 15, 2026. Final-demand producer prices increased 1.3% in September and 6.3% over 12 months, with final-demand goods prices rising 2.6% during September. Source
- U.S. Bureau of Labor Statistics — Consumer Price Index, September 2026. CPI increased 0.6% in September and 3.7% over the previous 12 months. Source
ENLOSA: Global Business Solutions
Strategy. Leadership. Execution.
enlosa@enlosa.com | +1 (877) 246-1109
#WednesdayEnvironmentScan #EconomicOutlook #Manufacturing #Demand #Capacity #SupplyChain #Inflation #DurableGoods #IndustrialProduction #PMI #WorkingCapital #CapEx #Pricing #Operations #COO #CFO #CEO #SIOP #StrategicPlanning #ScenarioPlanning #OperationalExcellence #Execution #ValueCreation #OperationalValueCreation #Strategy #Stratactic #ENLOSA #EGBS
Leave a Reply